
Vesmir COVID-19 Weekly Update, 04/03/2021
Summary
The U.S. markedly worsened in terms of COVID-19 cases this week and the improvement in death rate is slowing. On the positive side, rapid vaccinations in the U.S. continue with 31.2% of the population now having their first shot.
Globally the situation looks worse, as vaccinations are slower in most of the world than in the U.S. Notable exceptions are the U.K. and Israel which are both improving.
U.S. COVID-19 County-level Overview
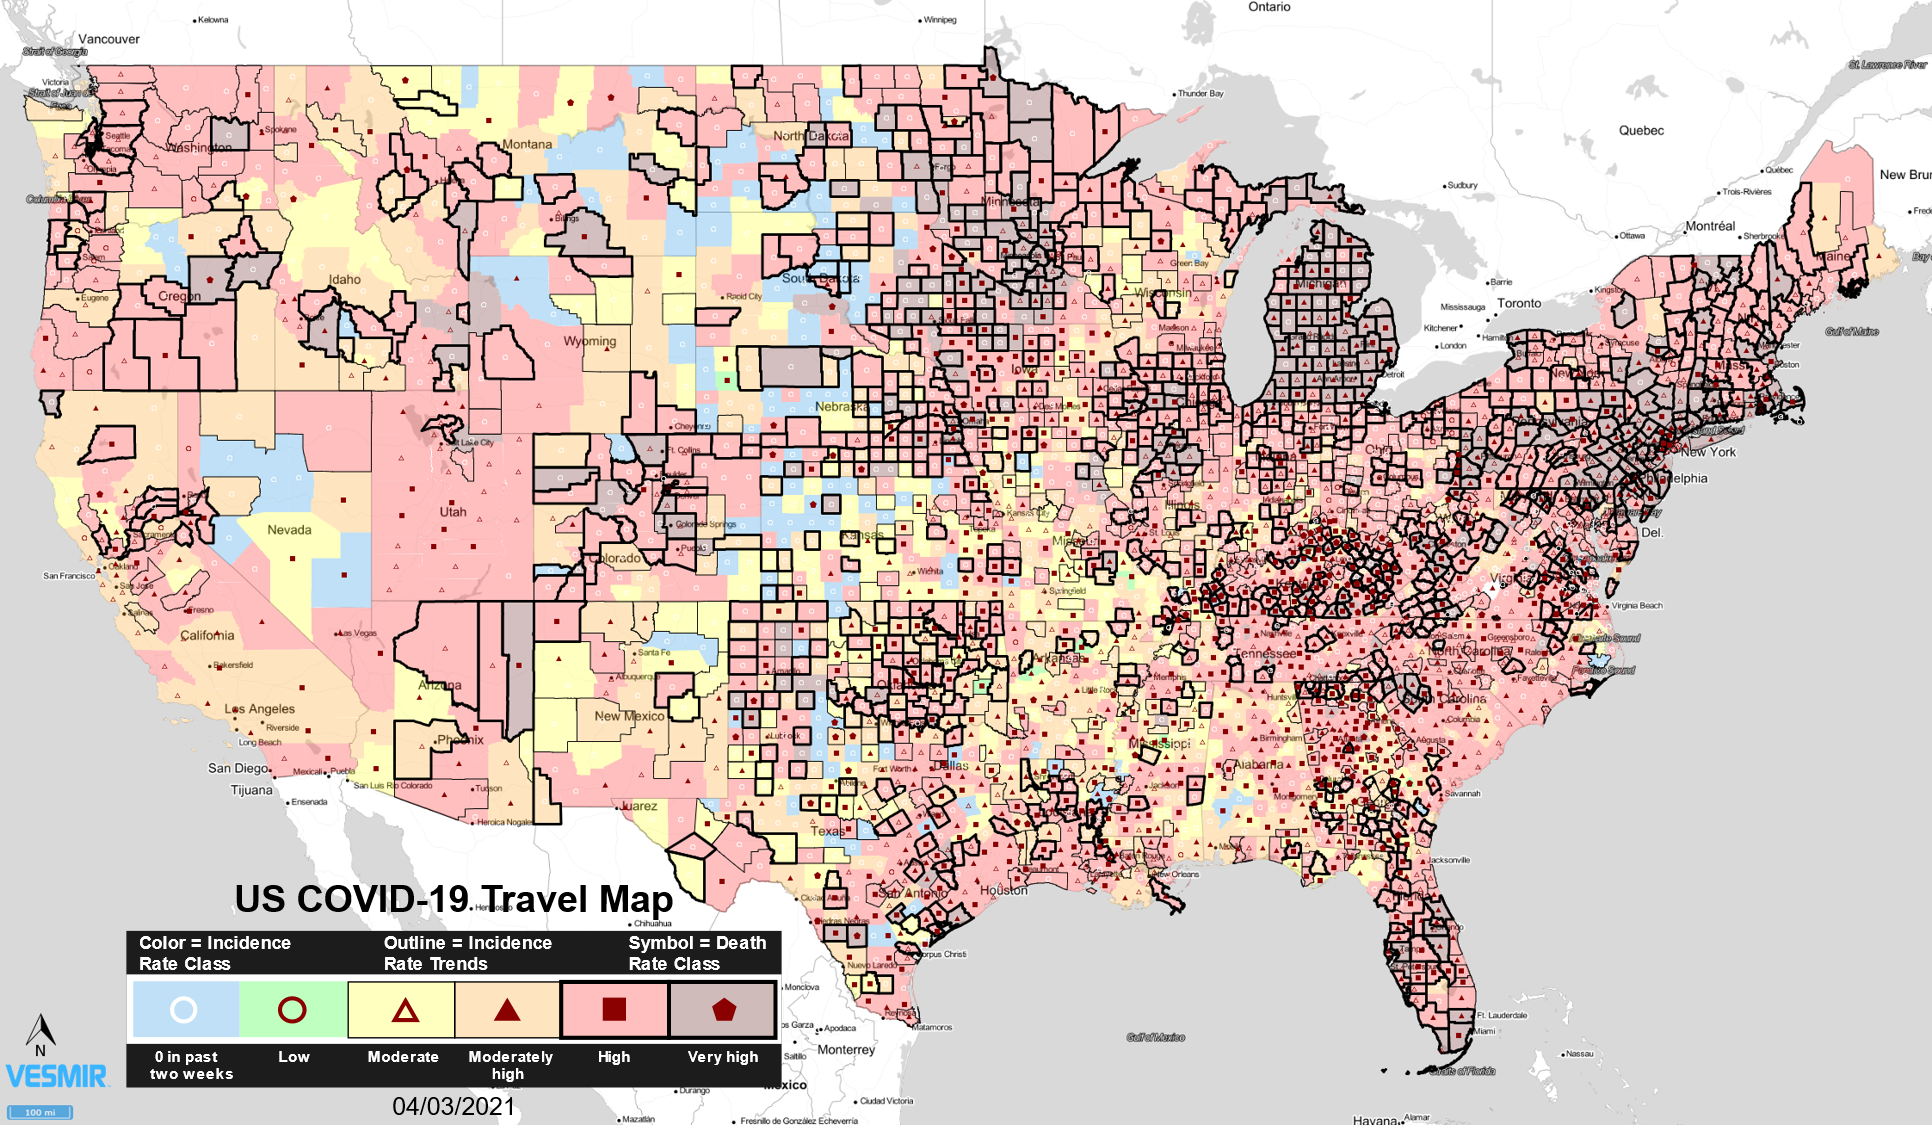
Incidence rates have worsened this week in total, but death rates continue to improve in the U.S. this week. 64.3% of U.S. Counties are in or above the High Incidence Rate Class. Those counties are in red or maroon on this map. Notice especially populated counties around New York City that continue to worsen, as well as Michigan and Florida.
Average daily deaths in the U.S. for a two-week period are now at 868 deaths/day down from 962 deaths/day last week. To reach typical flu death rates, we need to drop to 100 deaths/day in the U.S.
U.S. COVID-19 County-level Detail
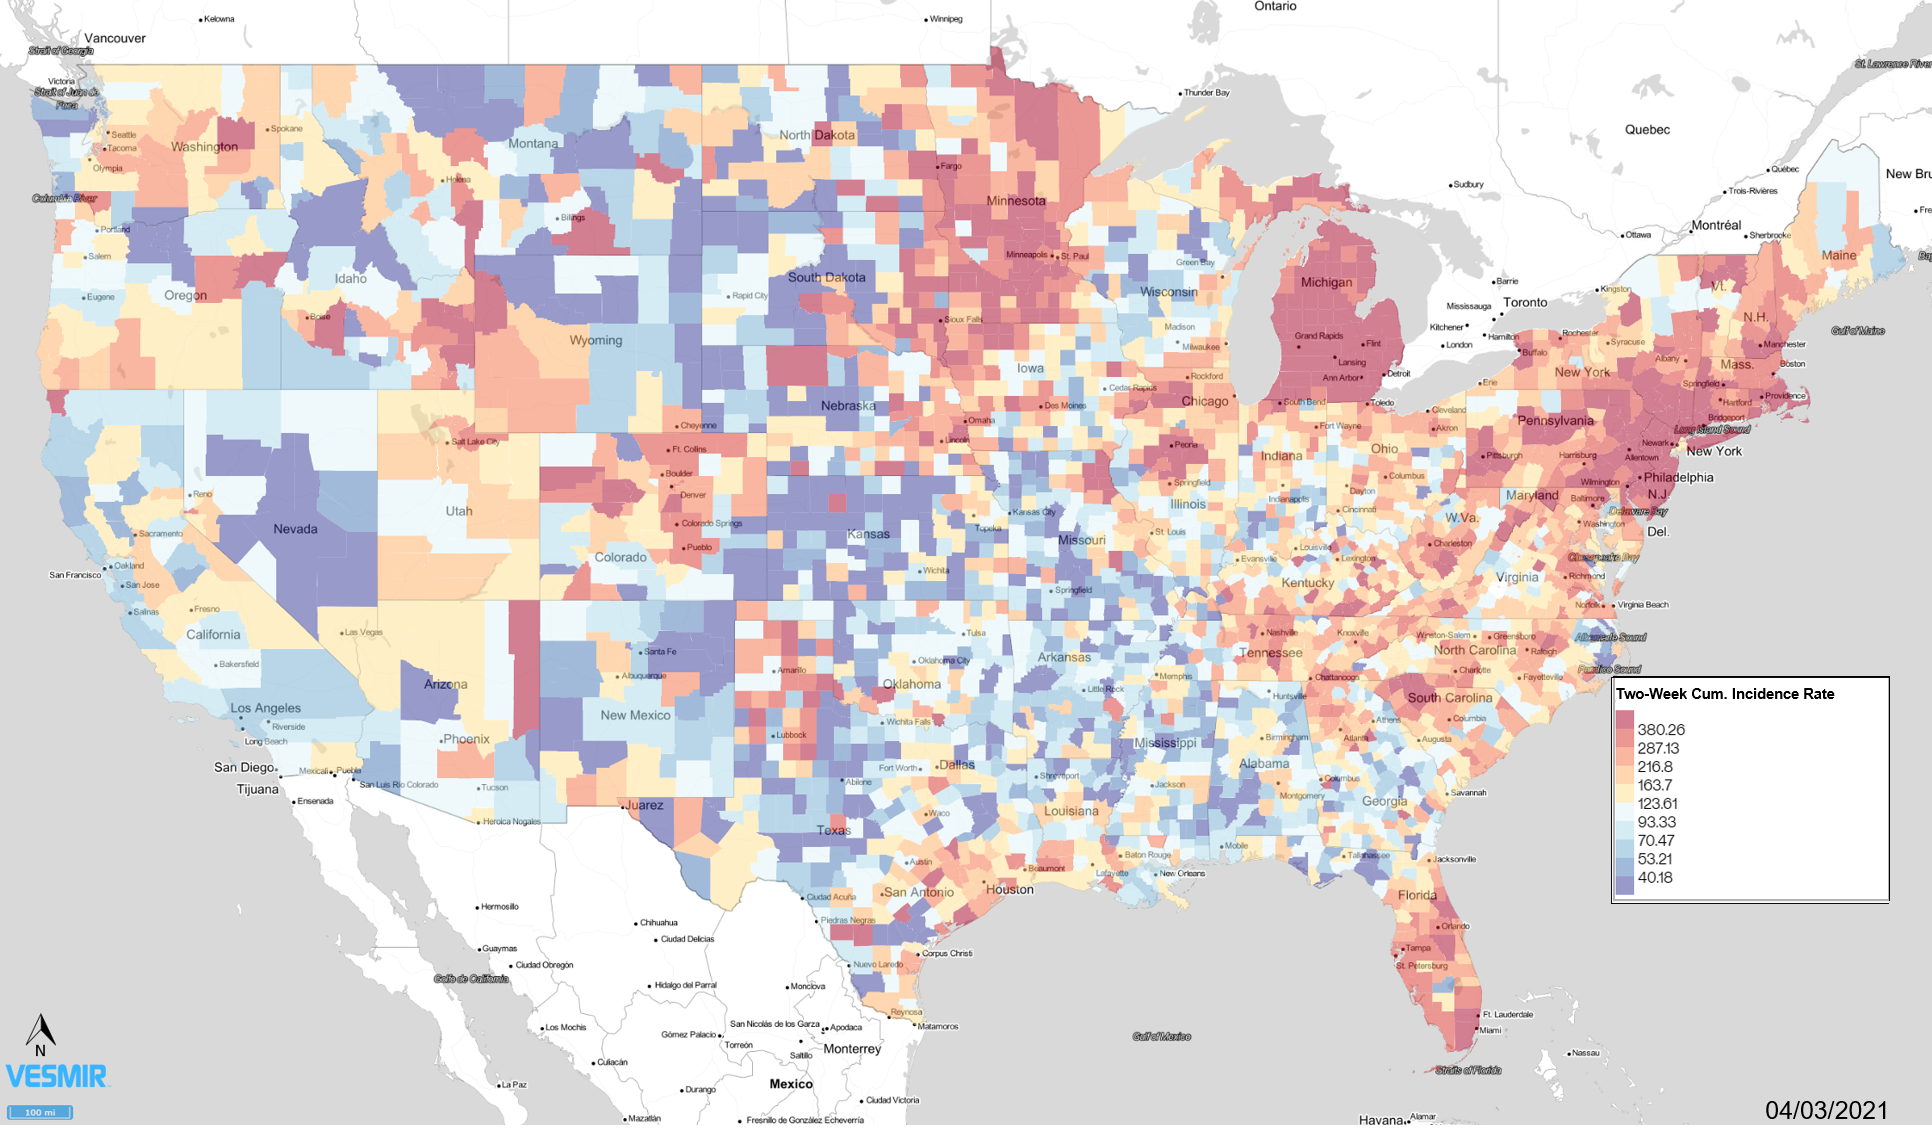
It is concerning to see continued rising rates around New York City and in Michigan per JHU data this week. Incidence rates in total are rising in the U.S.
The cutoff for Two-Week Cum. Incidence Rate of the top 10% of counties has risen from 353 to 380 and the lowest 10% remained at 40 in the past week for an average rise of 4%. This is the first time this metric has risen since 1/9/2021.
12% of U.S. counties have incidence rates of 350 per 100,000 people or higher, putting them in the Very high Incidence Rate Class, up from 10% witnessed last week.
64.3% of U.S. Counties are in or above the High Incidence Rate Class.
U.S. COVID-19 State Incidence Rate Trends
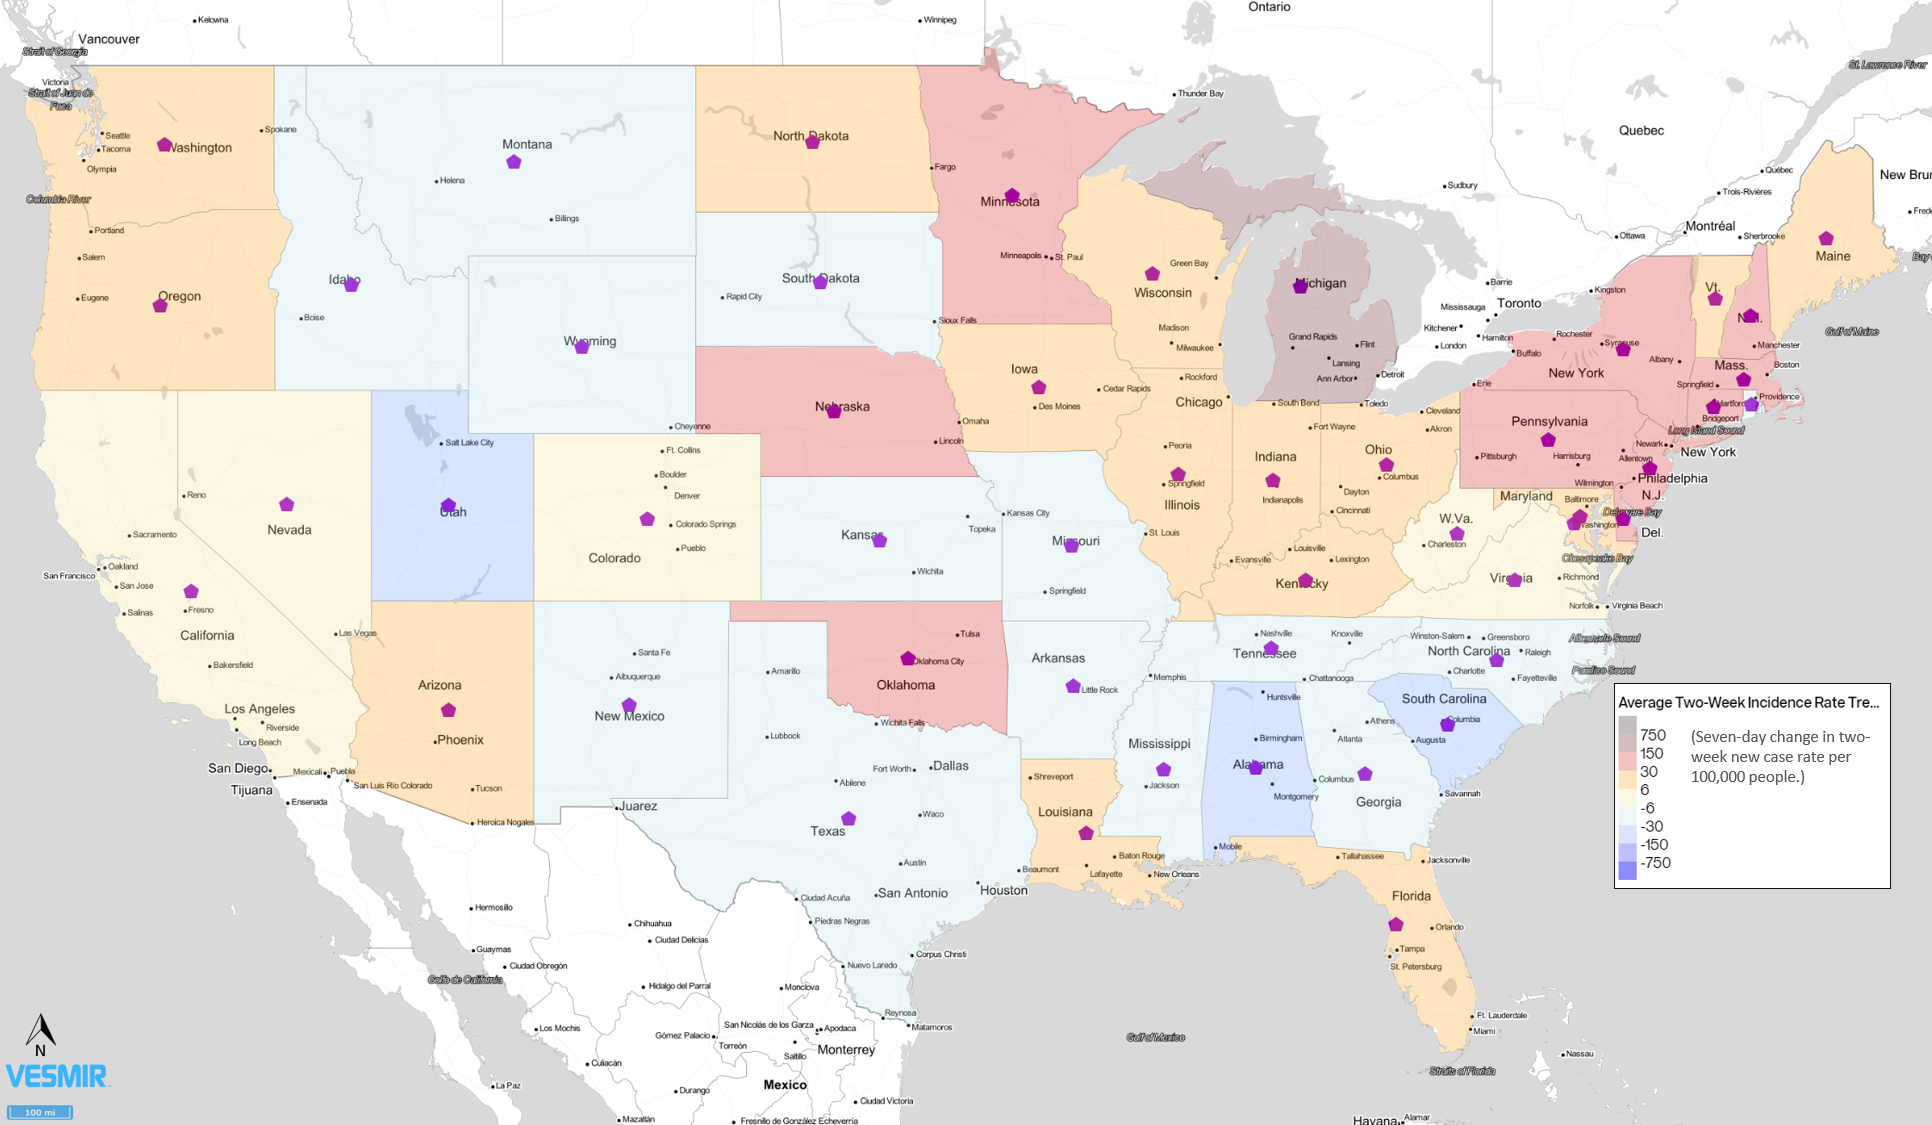
Incidence rates in total are rising in the U.S. according to this week’s JHU report. Eleven states see most counties worsening up from nine states last week. Michigan is especially notable as they are the only state with the average county being in the Very High Incidence Rate class. Numerous states around NYC are experiencing problems.
Death rates continue to improve with the two-week death rate now at 868 deaths per day. Not great, but much better than the 3,152 deaths per day we were seeing January 16th.
U.S. COVID-19 Death Rate Trends
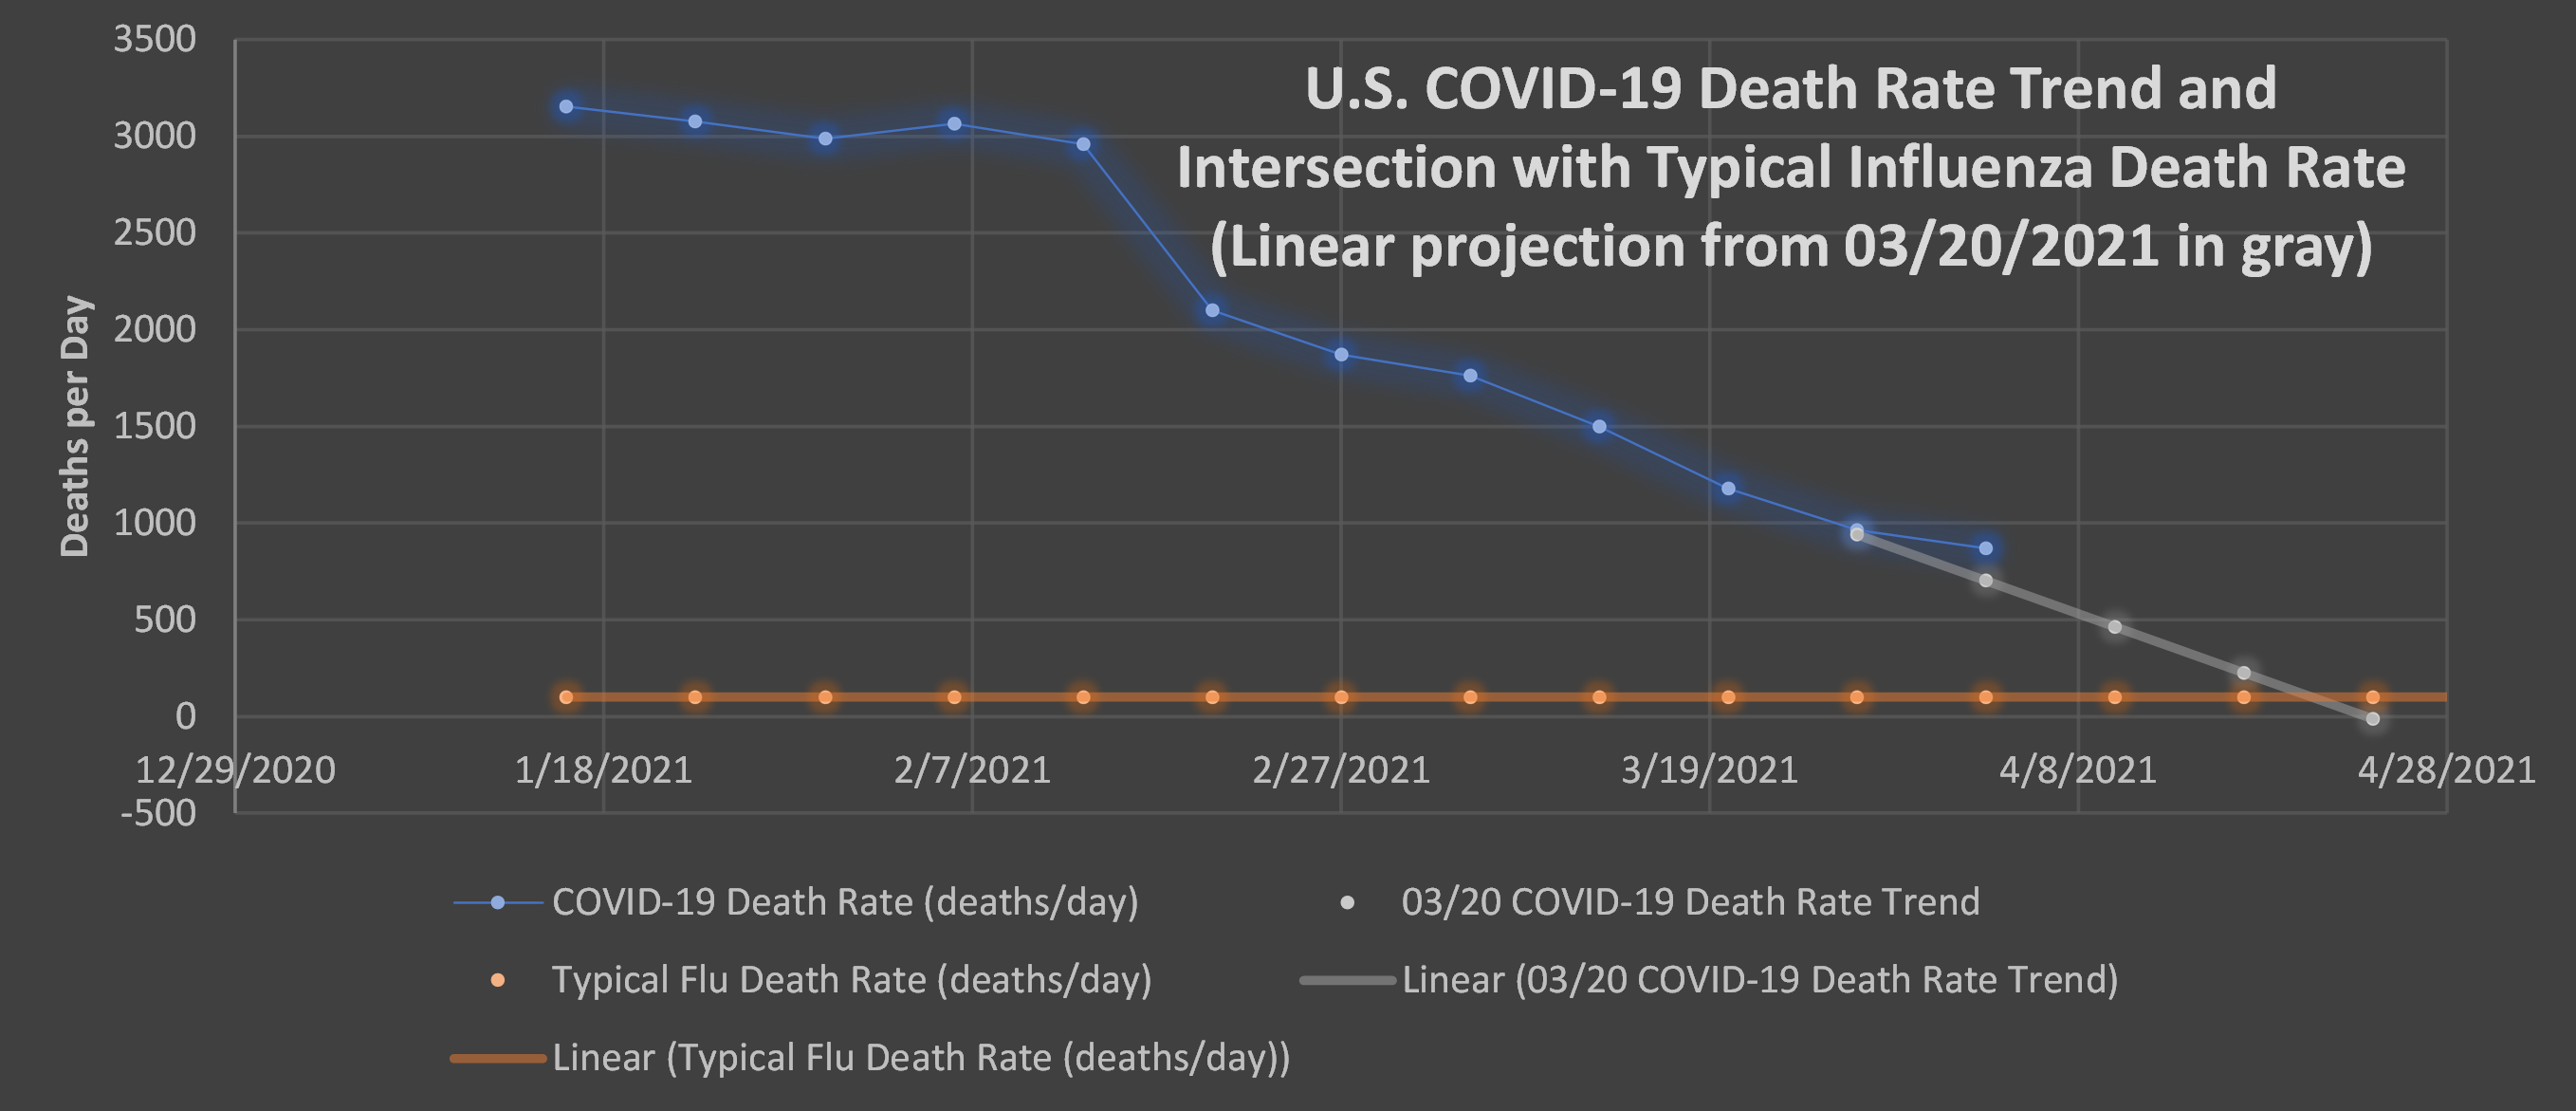
Death rates have been falling rapidly in the U.S., but that improvement is slowing. The gray line is what the decline would look like if it continued on the linear trend from 03/20/2021. Notice that the blue line marking actual deaths is now above that gray line indicating that the death rate is flattening.
COVID-19 Death Rates need to fall to 100/day to match the approximate daily rate of death for influenza.
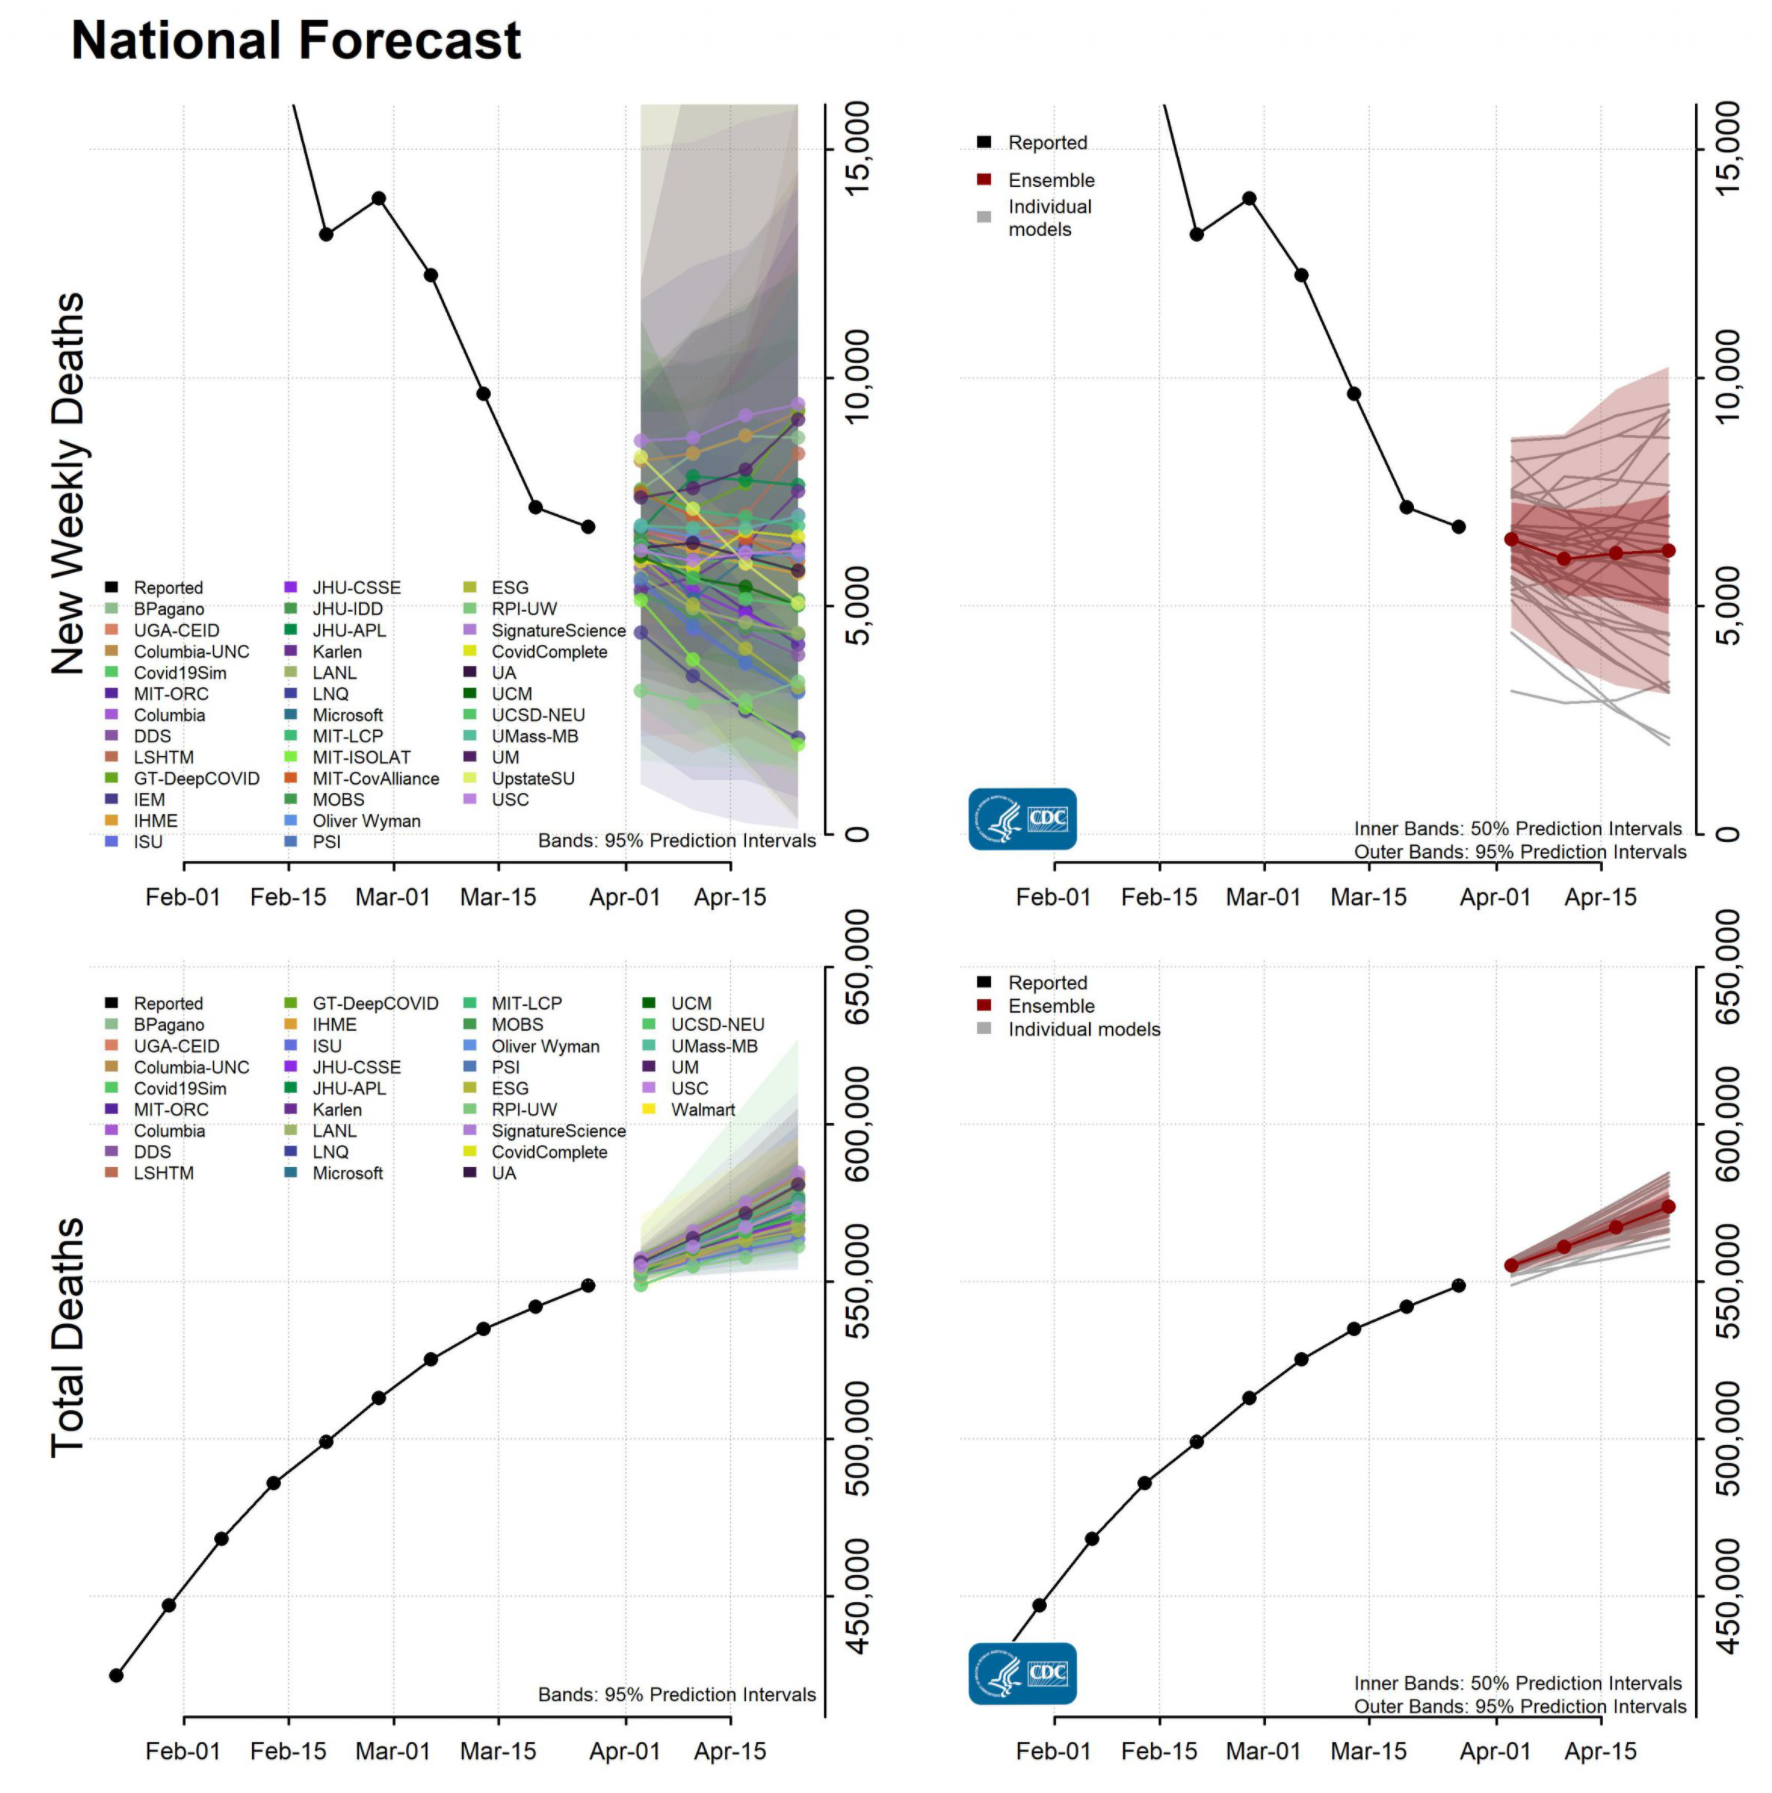
The CDC, as of their March 31st report, forecasts an increase in deaths as of April 15th. There is considerable variance in the models and room for action to prevent this, but the current forecast is worsening.
Global COVID-19 Overview
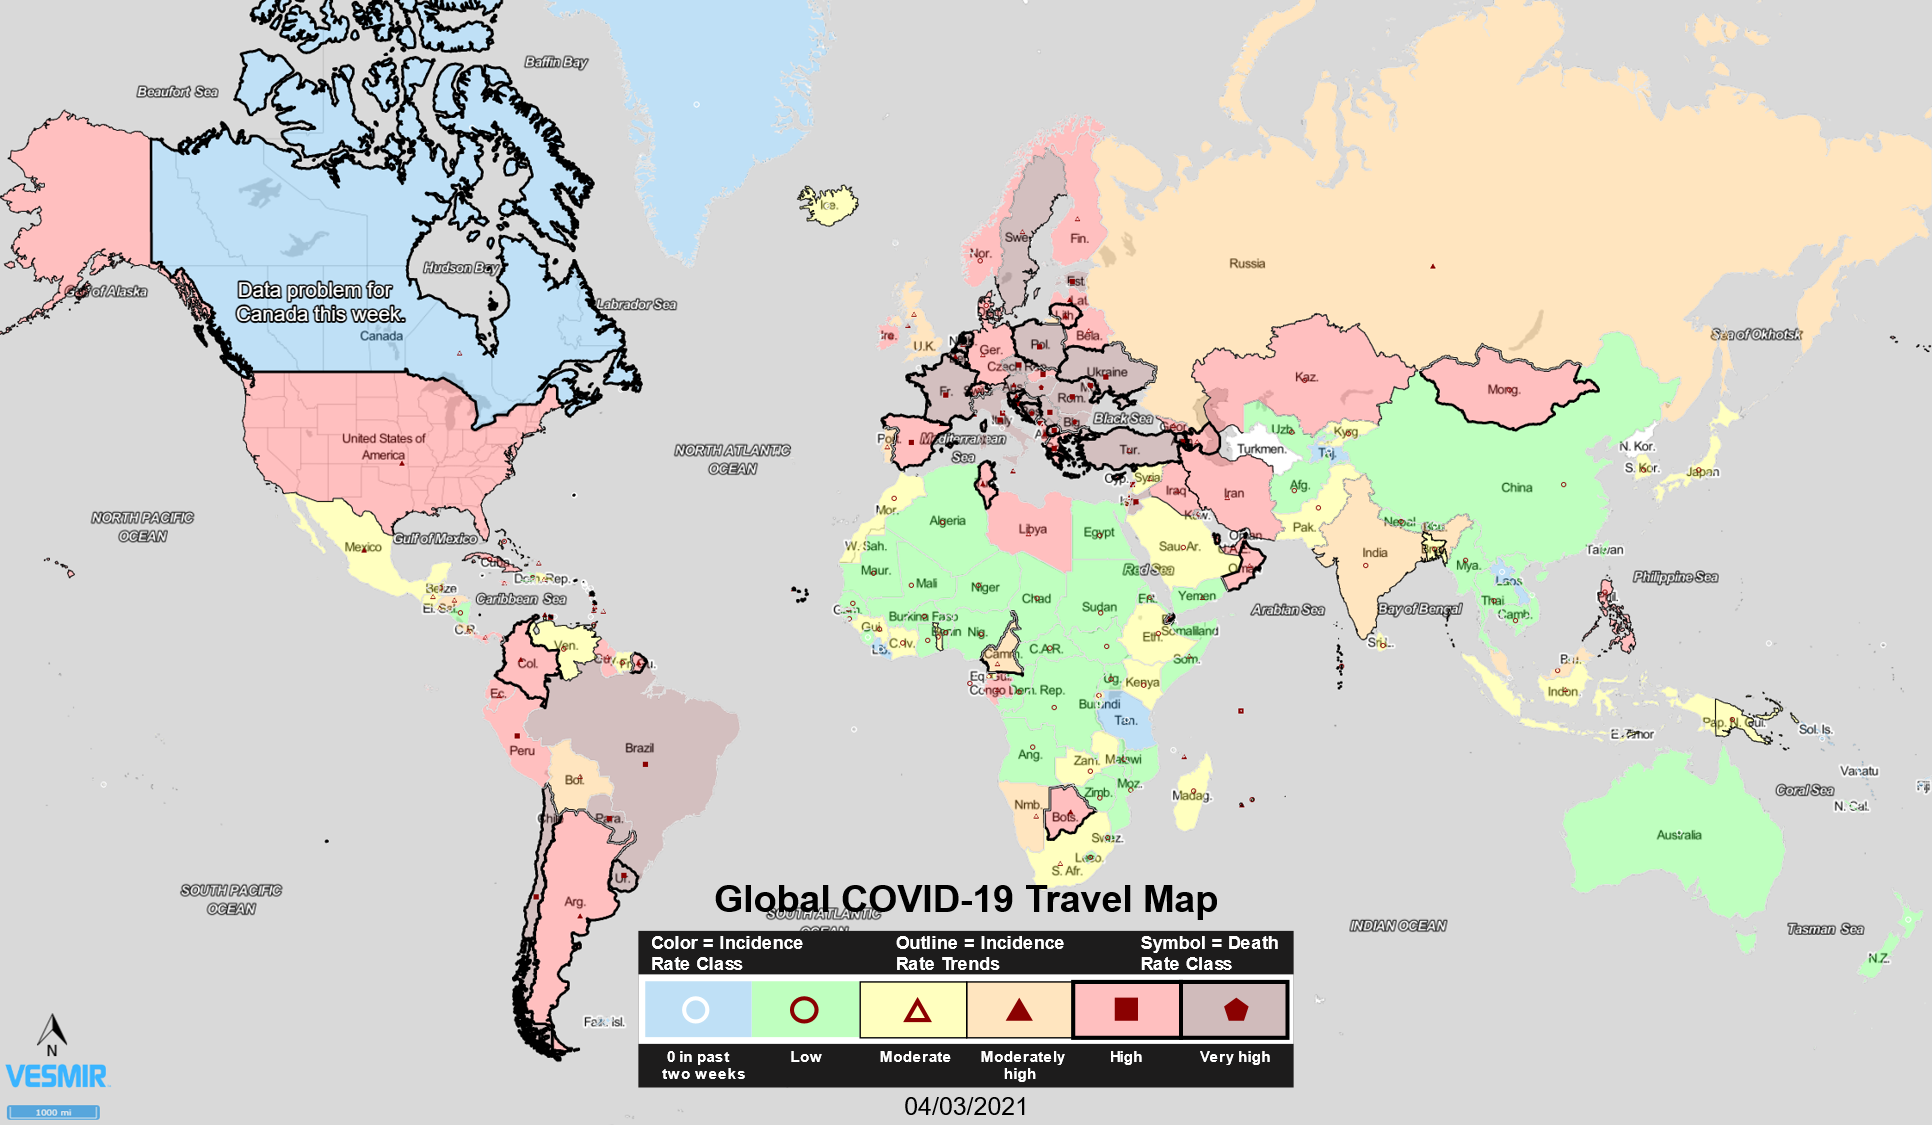
Most of Europe continues to worsen and South American issues in Brazil, Chile, and Uruguay in particular are concerning. India is also worsening and that is a major issue with their large population.
Israel continues to improve in both deaths and incidence rates and continues to lead the world in vaccination rate.
A complete set of U.S. and Global COVID-19 Travel Maps can be found here: https://covid19.vesmir.com/
You can reach Alan Lindsey, on Twitter: @Azrlindsey.
No comments