
Vesmir COVID-19 Weekly Update, 03/27/2021
U.S. COVID-19 County-level Overview
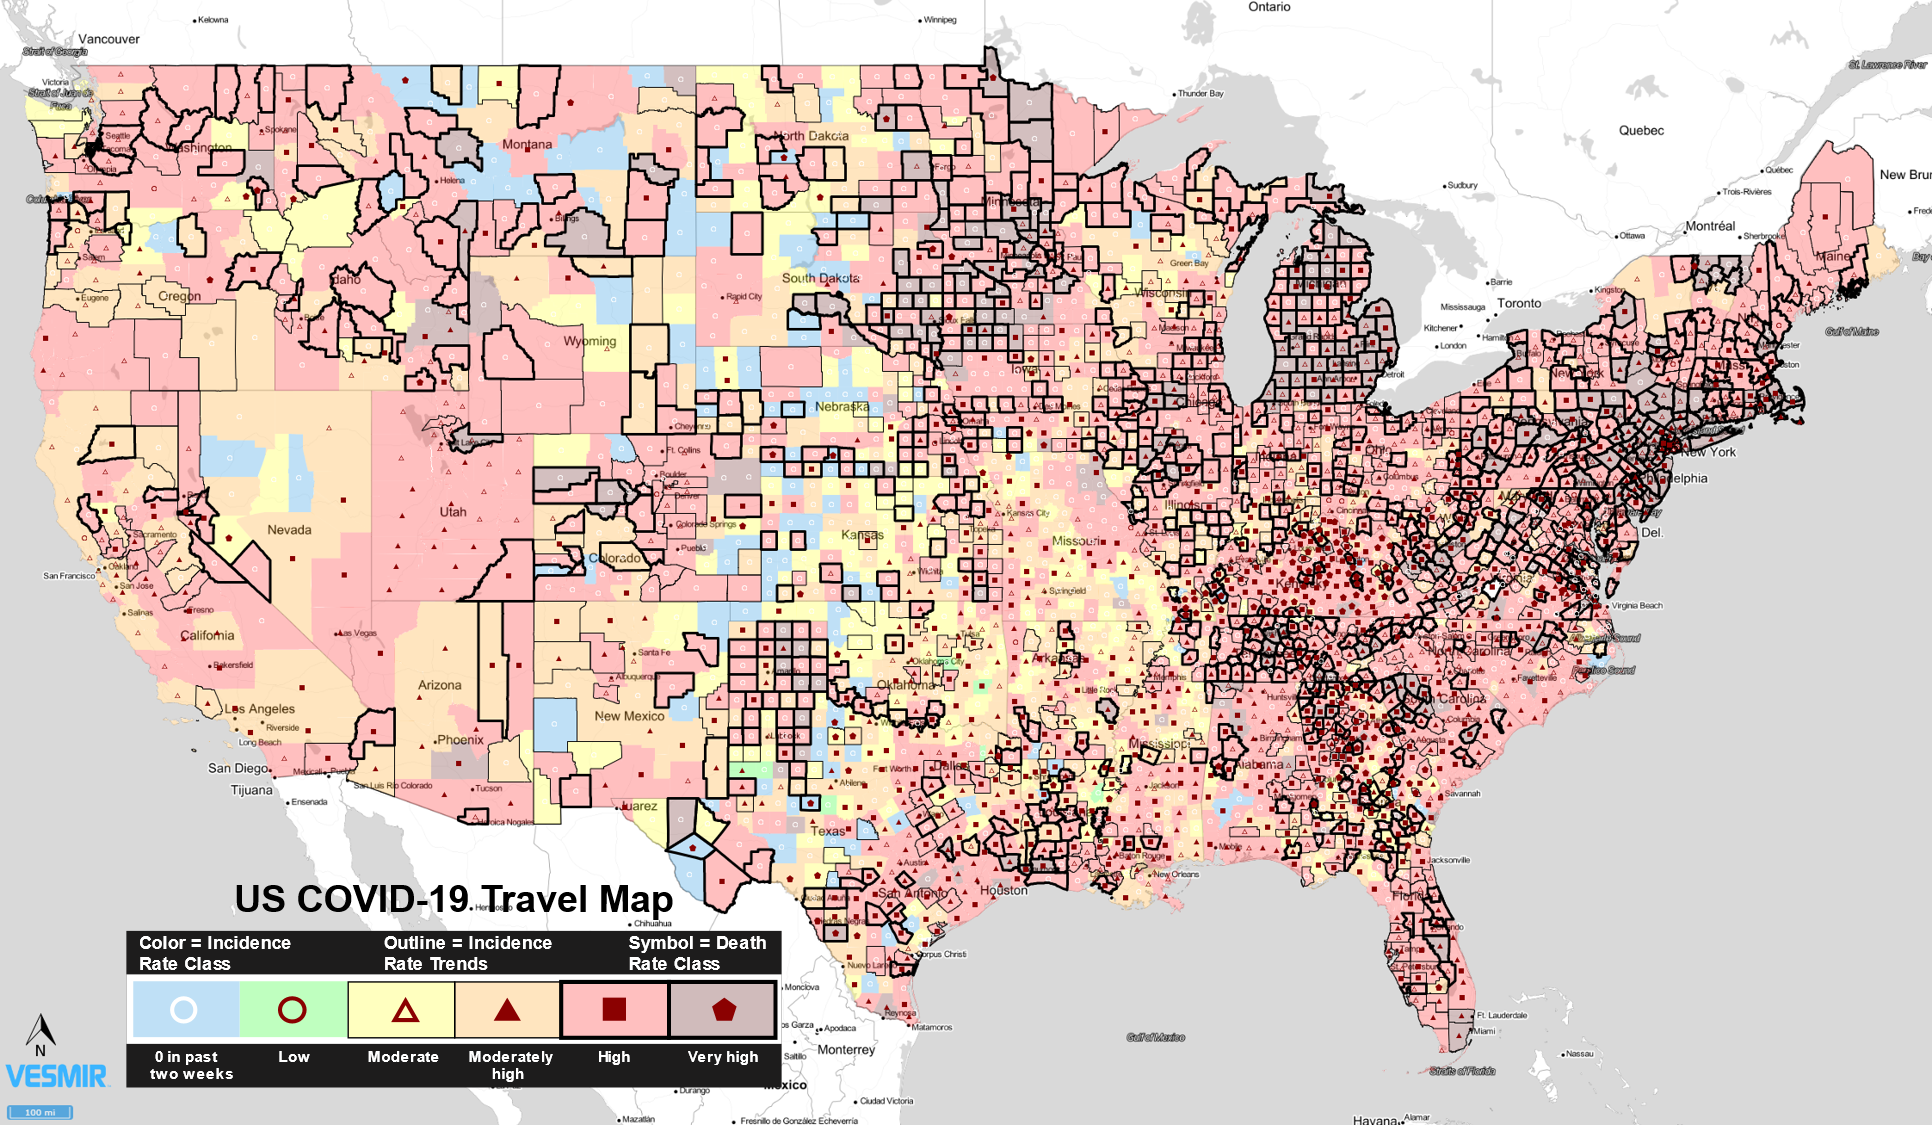
Incidence rates have worsened this week in total, but death rates continue to improve in the U.S. this week. 63.7% of U.S. Counties are in or above the High Incidence Rate Class. Those counties are in red or maroon on this map. Notice especially populated counties around New York City that continue to worsen, as well as Michigan.
Average daily deaths in the U.S. for a two-week period are now at 962 deaths/day down from 1,179 deaths/day last week. To reach typical flu death rates, we need to drop to 100 deaths/day in the U.S.
U.S. COVID-19 County-level Detail
It is concerning to see continued rising rates around New York City and in Michigan per JHU data this week. Incidence rates in total are rising in the U.S., but most counties are seeing improvement.
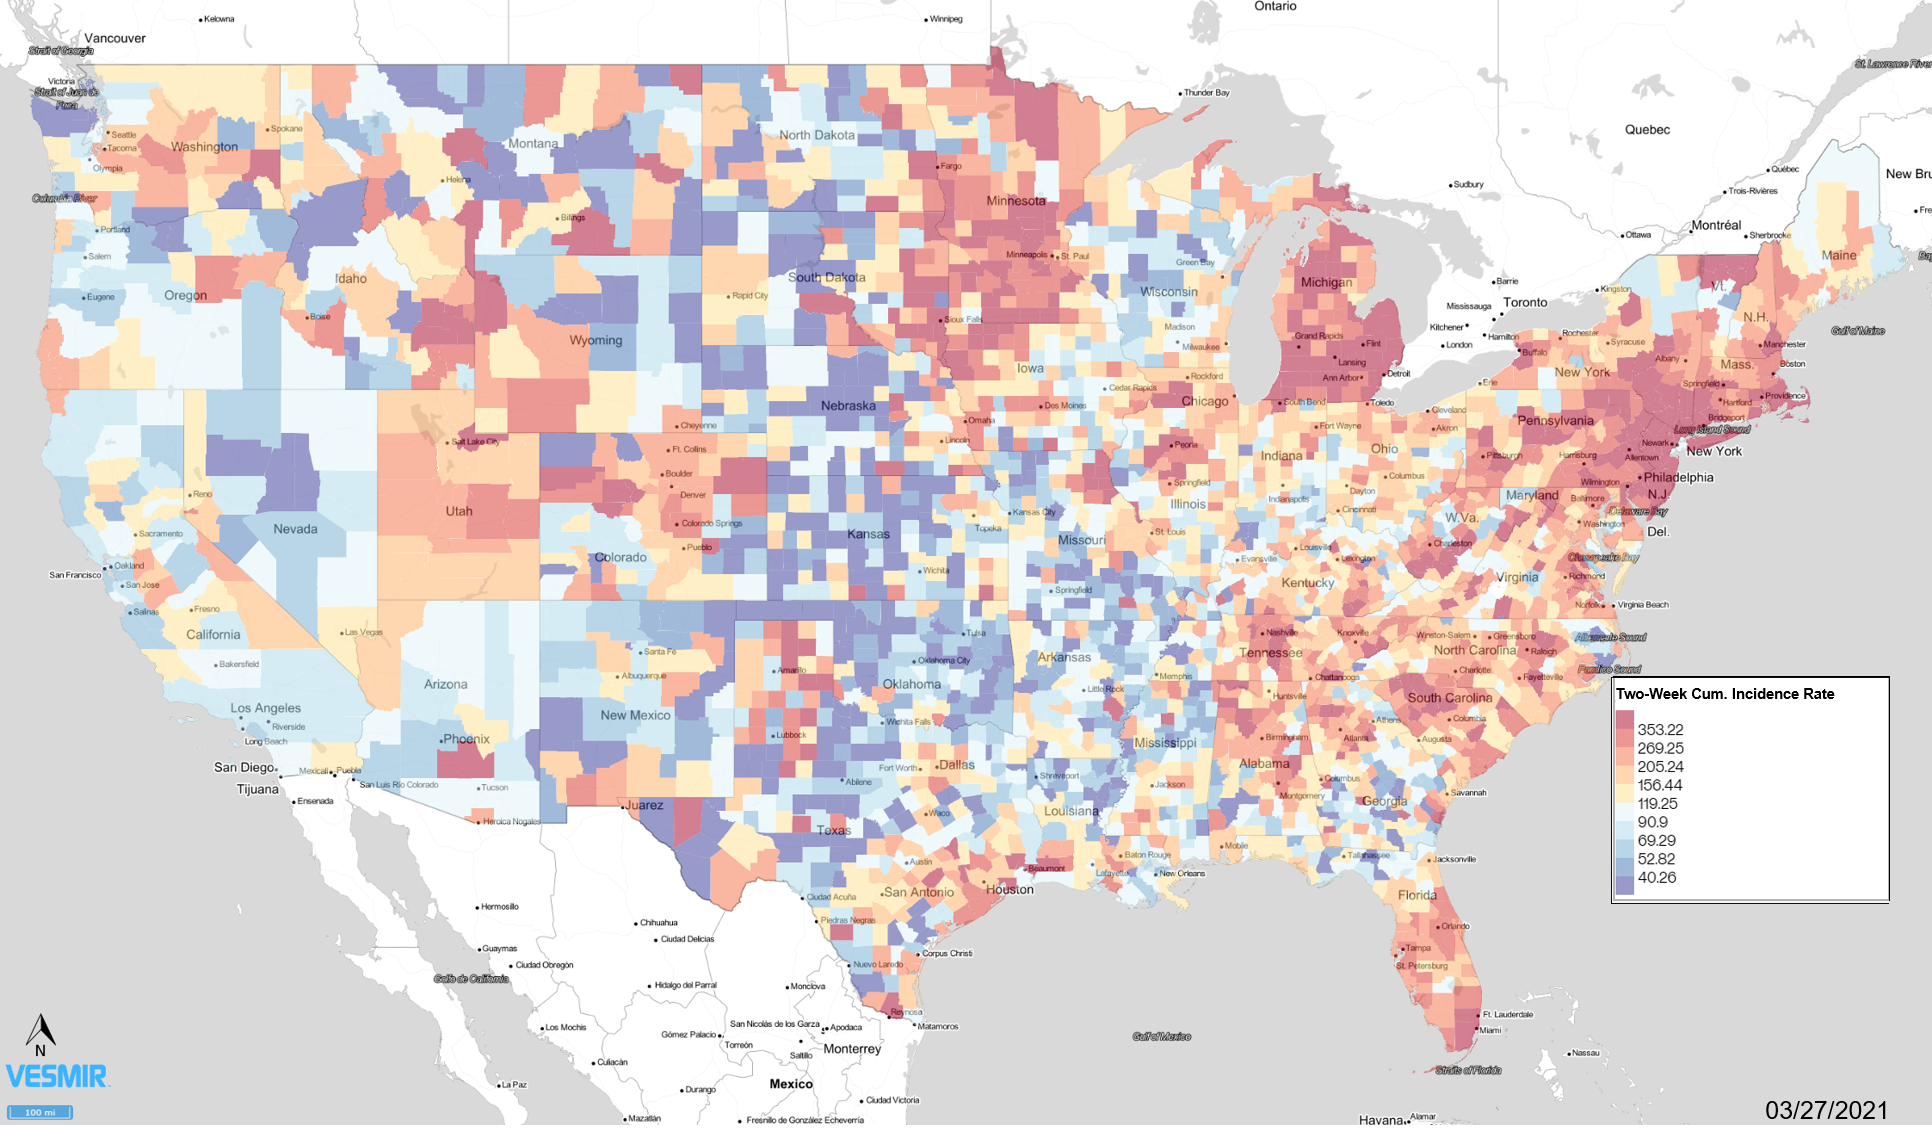
The cutoff for Two-Week Cum. Incidence Rate of the top 10% of counties has fallen from 373 to 353 and the lowest 10% fell from 44 to 40 in the past week for an average drop of 7%.
10% of U.S. counties have incidence rates of 350 per 100,000 people or higher, putting them in the Very high Incidence Rate Class, slighty less than the 11% witnessed last week.
63.7% of U.S. Counties are in or above the High Incidence Rate Class.
U.S. COVID-19 State Incidence Rate Trends
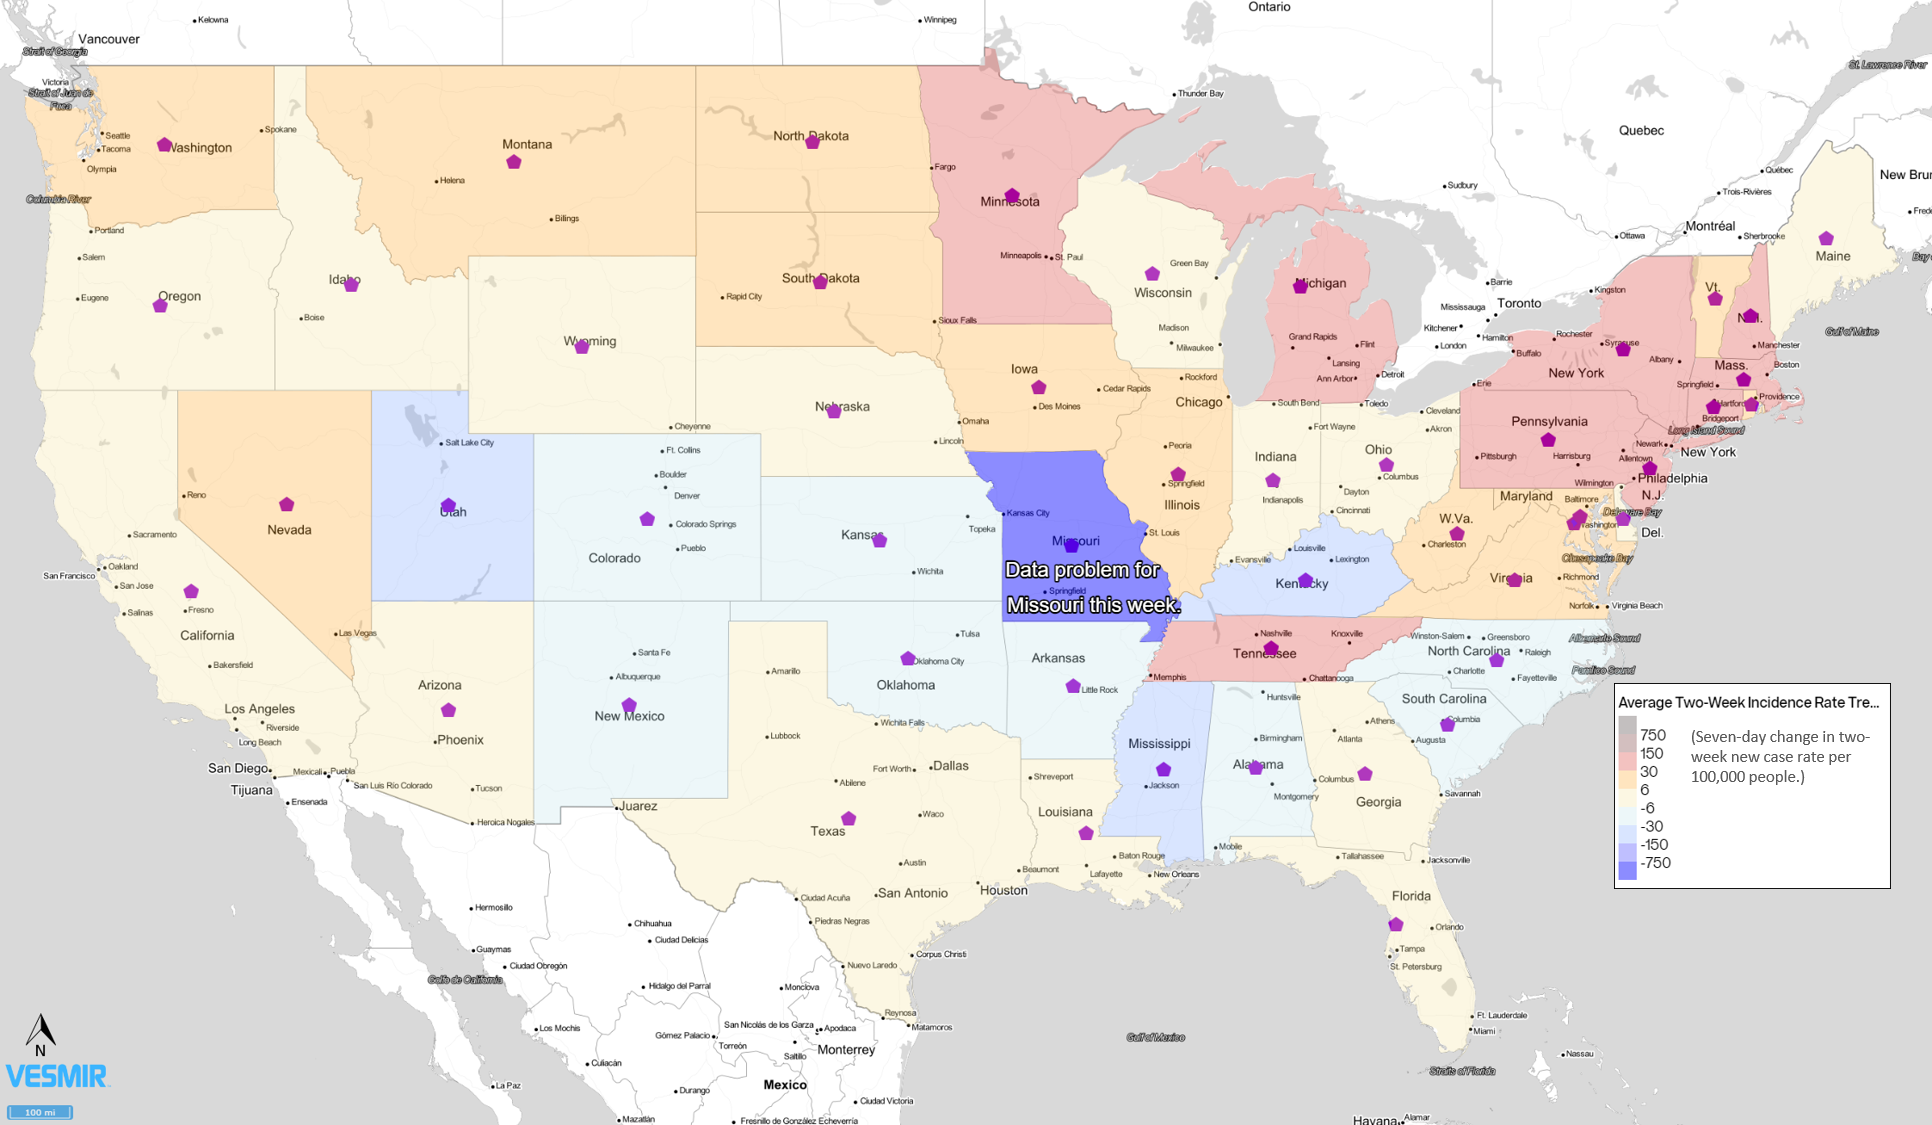
Incidence rates in total are rising in the U.S. according to this week’s JHU report. Nine states see most counties worsening up from 4 states last week. Michigan is notable with its higher rate this week, and numerous counties around NYC are experiencing problems.
Death rates continue to improve with the two-week death rate now at 962 deaths per day. Not great, but much better than the 3,152 deaths per day we were seeing January 16th.
Data problems this week in Missouri make conditions look better than they are.
U.S. COVID-19 Death Rate Trends

This chart is from last week, and shows how death rates have been falling rapidly in the U.S. The gray line is what the decline would look like if it continues on this linear trend. This will be updated again next week.
COVID-19 Death Rates need to fall to 100/day to match the approximate daily rate of death for influenza.
Global COVID-19 Overview
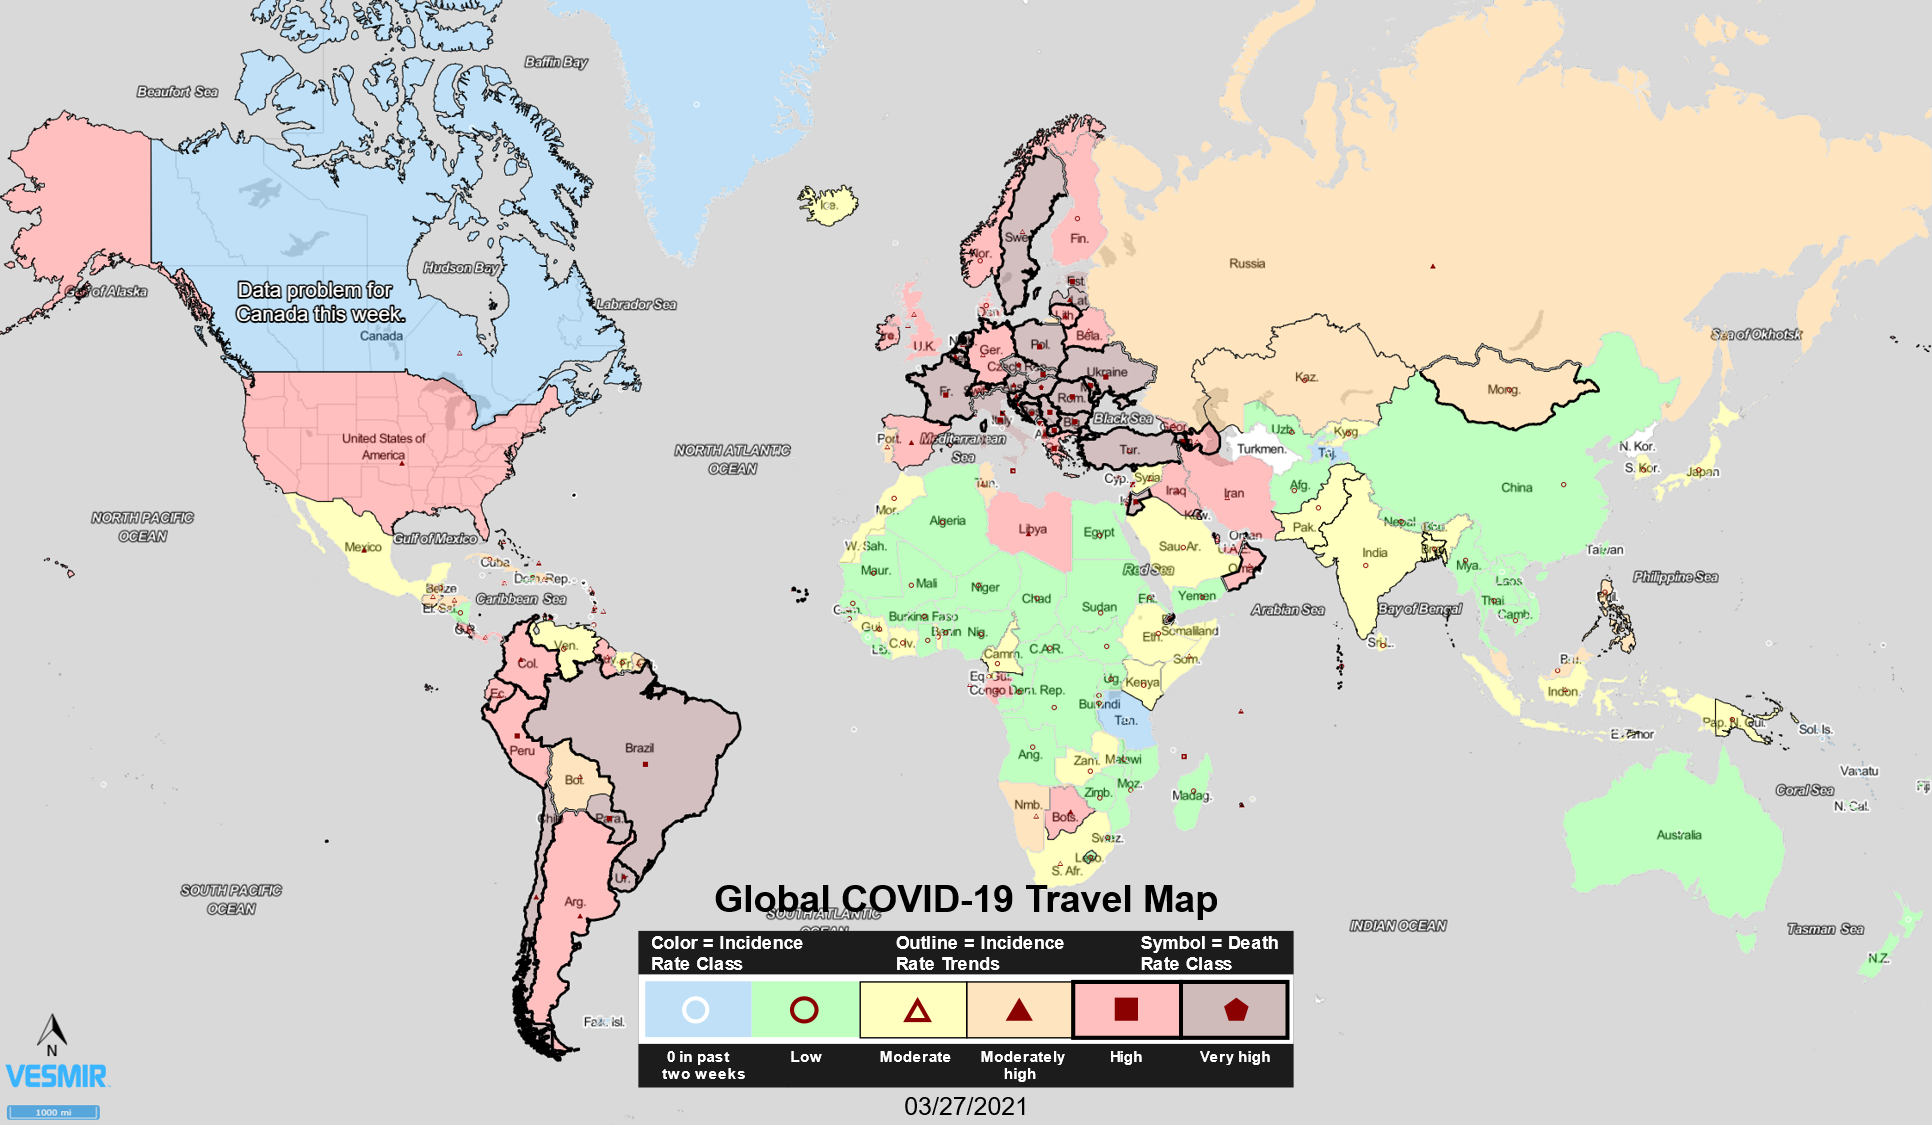
This is a strange time globally, per this week’s JHU report, as vaccines are rolling out rapidly in some areas and much too slowly in others. Europe continues to worsen and South American issues in Brazil and Uruguay in particular are concerning.
Israel continues to improve in both deaths and incidence rates and continues to lead the world in vaccination rate.
A complete set of U.S. and Global COVID-19 Travel Maps can be found here: https://covid19.vesmir.com/
You can reach the author, Alan Lindsey, on Twitter: @Azrlindsey.
No comments